How to cite this article: Agarwal K, Manoharan F, Kapoor N. Understanding Body Composition Analysis in Obesity Management. J Assoc Physicians India 2025;73(4):11-17.
INTRODUCTION
The incidence of lifestyle diseases, namely obesity, diabetes mellitus, hypertension, metabolic syndrome, etc., is increasing across the world. There are different phenotypes of obesity, and body composition analysis has now become an essential part of clinical practice. It is needed to provide a better understanding of the functional capacity of the body, the muscle composition, and the amount of fat in various parts of the body.
Obesity causes alterations in body composition, which impact metabolism, insulin sensitivity, and the development of diabetes and other metabolic diseases. 1 There is a need to measure muscle mass and strength accurately to identify individuals at risk of developing these diseases so that adequate preventive interventions can be taken. Additionally, these measurements can also be used to assess the effect of each intervention.
Radiological imaging, such as computed tomography (CT) and magnetic resonance imaging (MRI), which can also measure fat deposition and infiltration in various organs, are the gold standard for body composition assessment. 2 The body composition methods can be divided as the following 3 :
Direct methods: These methods involve analysis at the cellular level and include neutron activation, total body counting, and isotope dilution.
Criterion methods: These methods use a property of the body, such as the density of bone, fat, muscle, etc., to describe their amount and distribution in the body and include CT, MRI, and dual energy X-ray absorptiometry (DEXA).
Indirect methods: These include anthropometry and bioimpedance analysis (BIA). They depend on the measurement and distribution of various tissues among the normal population and hence are prone to larger predictive errors. 4
All the methods of body composition assume a fixed concentration of water and electrolytes or density of body tissues and the interrelationship and distribution of various components of the body, such as muscle, fat, and bone, in healthy individuals. 5 The assumptions may not hold true in chronic disease, cachexia, or morbid obesity. It is important to assess these results within the scope of their limitations.
MODELS OF BODY COMPOSITION
Assessment of body fat has historically been difficult. There are four models of body composition. 6
Two-compartment (2C) Model
In the two-compartment (2C) model, the body is divided into fat mass (FM) and fat-free mass (FFM). The FFM is easier to estimate, and the FM is the difference between total body weight and FFM. The method involves measuring total body density, and FFM density is assumed to be constant. 7 The methods include air displacement plethysmography (ADP), hydrodensitometry, and hydrometry. The model assumes a constant density across ages: a density of 0.732 L/kg for body water 8 and 68.1 mEq/kg for body potassium. 9 The method was based on the analysis of young male cadavers, 10 and the assumptions of fat mass calculation were not accurate for extremes of age, different ethnicities, and females.
Three-compartment (3C) Model
The three-compartment (3C) model divides FFM into total body water (TBW) and solids (proteins, minerals, fat-free dry mass). It involves measurement of TBW and body density, assuming a constant mineral-to-protein ratio of 0.359. 7 It is better than the 2C model as it accounts for variation in hydration status. Body density measurement will not be accurate in people with low bone mineral or protein mass; therefore, estimation of FM can also be inaccurate. An example of the 3C model is DEXA.
Four-compartment (4C) Model
It divides the body into fat, mineral, TBW and protein and does not assume any definite proportion between these constituents. In this model, the density of protein is assumed to be 1.34 kg/L and that of minerals to be 3.075 kg/L. 11 It requires neutron activation analysis for protein measurement and DXA for bone mineral measurement. Since it is not widely available, protein mass is taken to be proportional to the BMC of the person.
There is an alternate four-compartment (4C) model, which divides the body’s FFM into body cell mass (BCM), extracellular water (ECW), and extracellular solids (ECS). The BCM measurement is based on total body potassium. 12 The ECW is measured using bromide or sulfate compounds. 13 The ECS compartment includes measurement of BMC, usually by DXA. The FFM is defined as BMC + ECW + ECS, and total body fat mass as body weight minus FFM.
The main drawback is that each primary measurement has a possible error, which can accumulate. The use is also limited due to time, cost, and equipment needed for the multiple compartment measurements and is mainly used to validate other methods of body composition.
Multicompartment Models
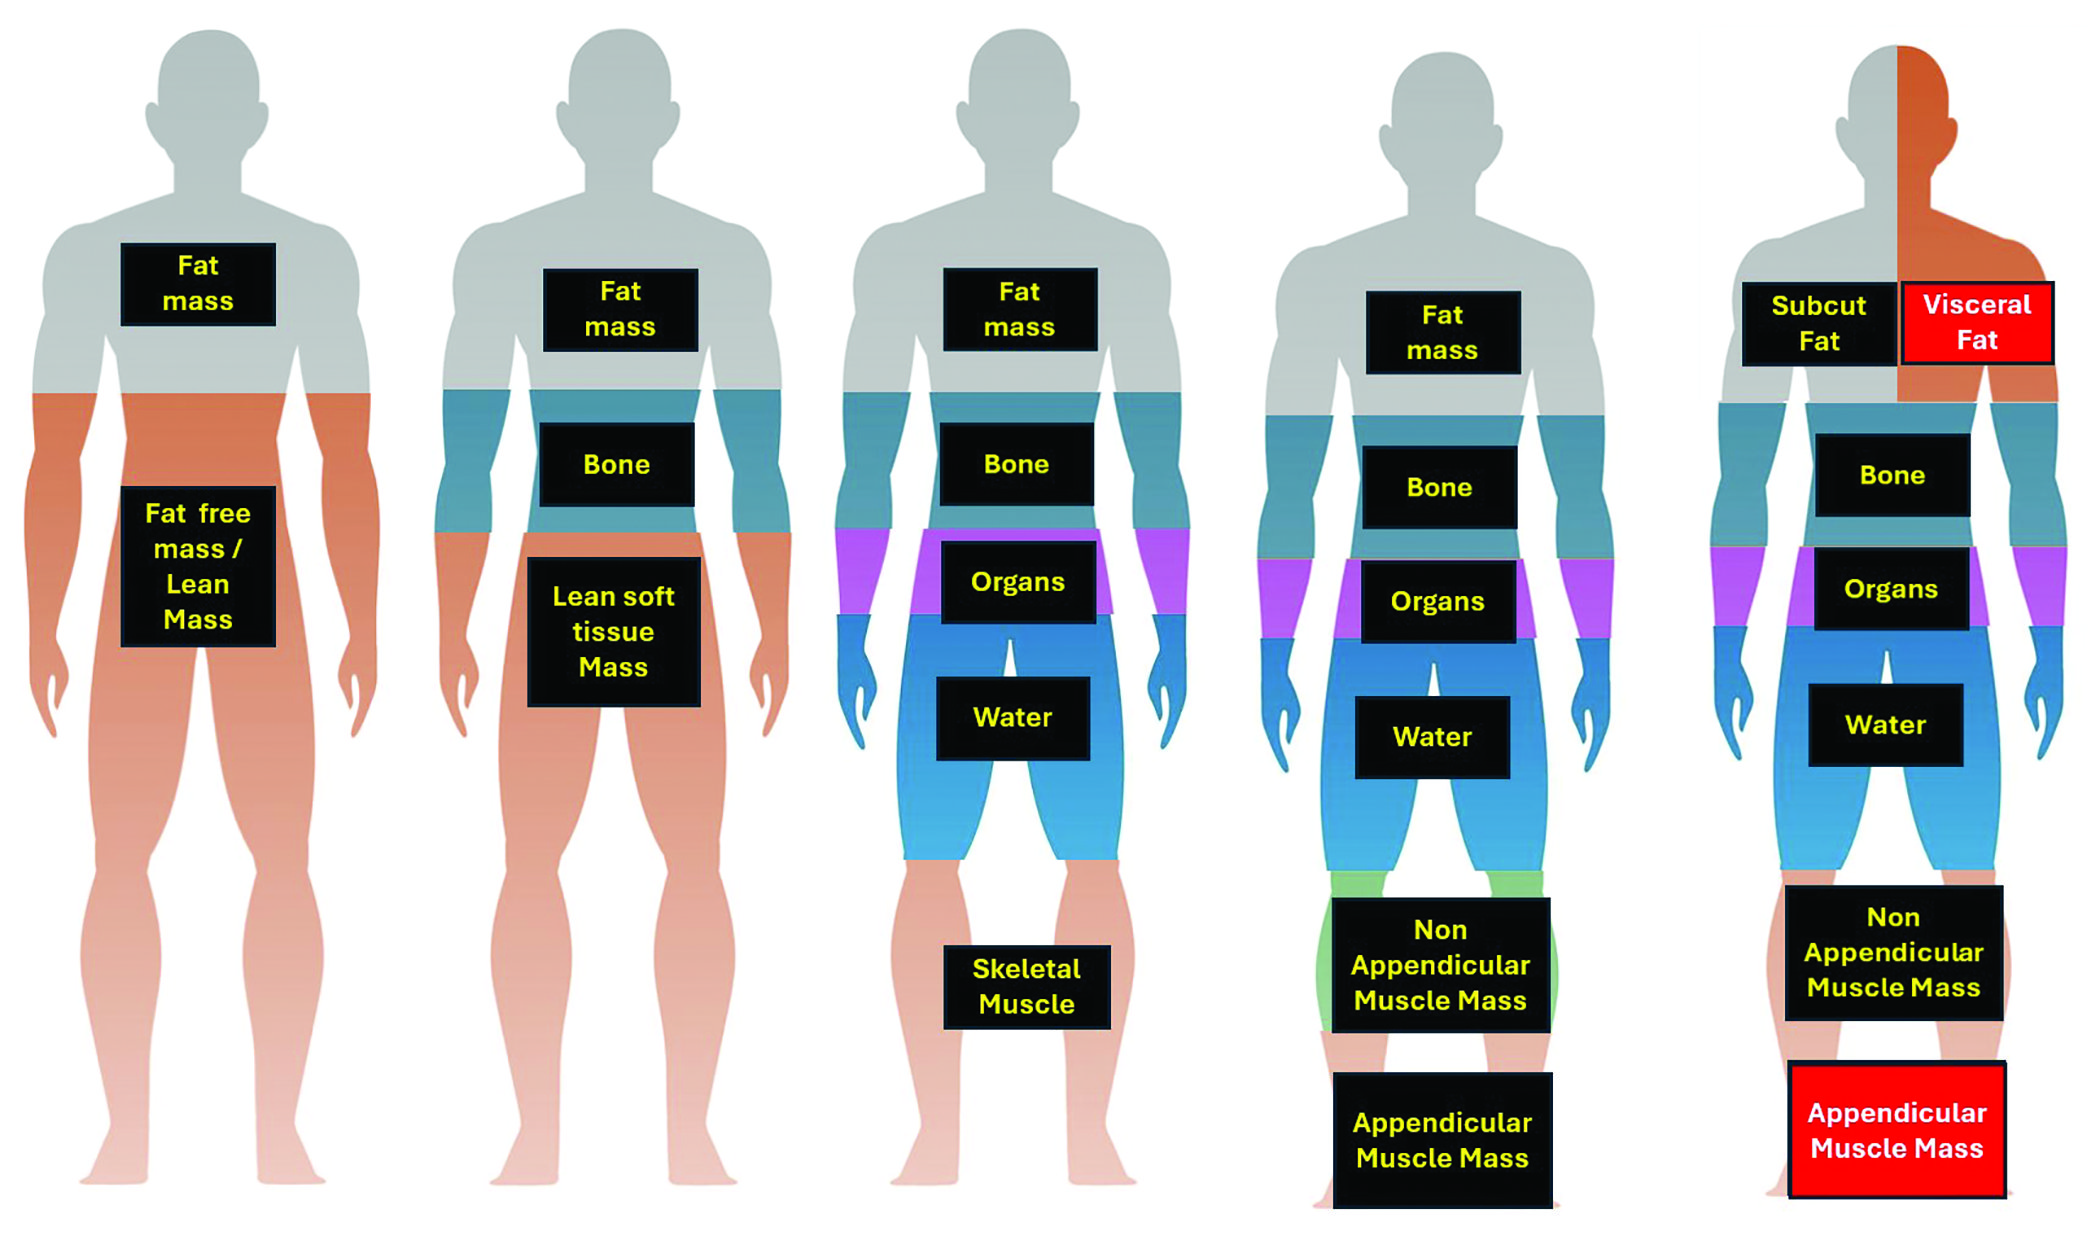
It involves direct analysis of elements like water, nitrogen, calcium, potassium, sodium, and chloride in the body. 14 While more accurate, high expense and radiation exposure make its use limited to experimental settings. It is particularly accurate for the first two years of life. 15 A comprehensive description of all the body composition models is described in Figure 1 .
Understanding different components of body composition
METHODS OF BODY COMPOSITION
Indirect Methods
Anthropometry
They describe the size and shape of the individual and were the initial methods of body composition assessment. 3 These noninvasive methods are useful to assess nutritional status, identify at-risk individuals, and assess the efficacy of nutrition or exercise interventions. They are simple to measure, nonexpensive, and easier for follow-up studies but cannot differentiate between muscle or fat loss. 16
Weight, Stature, and Body Mass Index
The most frequent measure of obesity is body weight, but it can be inaccurate as the changes can correspond to alterations in body water, fat, and/or muscle mass. One of the ways this is overcome is by the use of body mass index (BMI). BMI is weight divided by stature squared (kg/m 2 ). The main advantage of BMI is the presence of a reference database and multiple studies validating its relationship with levels of body fatness, morbidity, and mortality in adults. 17 It is ideal for wide population-based studies. For a given BMI, the percentage of body fat does not remain the same, as it changes with sex, ethnicity, and age. 18 It is not a sensitive indicator of body fat and metabolic risk, 19 especially in Asians. The Endocrine Society of India Obesity guidelines mention that a BMI of 23–24.9 kg/m 2 is considered overweight, while a BMI >25 kg/m 2 is considered obese. 20
Waist Circumference
It is a measure of abdominal obesity. It is measured in a standing position at the center of the line drawn from the lowest rib cage and the iliac crest at the end of expiration. 17 The cutoff used in Asian Indians is >80 cm for females and >90 cm for males. 20 Higher waist circumference increases the risk of developing type 2 diabetes mellitus, metabolic syndrome, and mortality. 21
Waist–Hip Ratio
Waist–Hip Ratio (WHR) tells us about the distribution of body fat. The cutoff defined for Indians is >0.8 for females and >0.9 for males. 20 In a study with over 500 subjects from North India, WHR and WC were the best predictors of metabolic syndrome. 22 In another population-based study, WC and WHR were the best predictors of diabetes. 23
Skinfold Thickness
Skinfold thickness (SFT) assesses subcutaneous fat, usually done with calipers measuring to the nearest 0.2 mm. It is measured at the biceps, triceps, subscapular, and supra-iliac areas, which are then used to calculate body density. 24 The main limitation is that most calipers have an upper limit of 45–55 mm, therefore of little use in people with morbid obesity. There is a national reference database for triceps and subscapular SFT. SFT is especially useful in children, as they have mostly subcutaneous fat, even at higher BMI. 25
METS-VF is another simple tool used to assess visceral adipose tissue in individuals with the help of anthropometry and simple biochemistry that has been validated in the Indian population. 26
Bioelectrical Impedance Analysis
Bioelectrical impedance analysis (BIA) depends on the electric conductive properties of the body, 27 involving measurement of impedance (Z) or interference to a low-electrical current (800 µA) at a fixed frequency (50 kHz). It can be a single or multifrequency device. It is based on the electricity conduction properties of water, electrolytes, and fat. The errors in measurement result from differences in the length of the limb, nutritional status, hydration, blood chemistry, ovulation, and placement of electrodes. 28 To correct for these, bioimpedance spectroscopy (BIS) or multifrequency BIA can be used, which differentiate BCM and TBW, 29 which correlate with estimates from 4C models. In individuals with obesity, the trunk has a greater proportion of body mass and body water, increasing the ratio of extracellular to intracellular water and decreasing the hydration of FFM, 30 because of which FFM is overestimated in obese individuals. 29 However, by optimal standardization, they provide a quick estimate of FFM. Because of large predictive errors, small improvements with treatment can be missed. 31 The BIA instrument is portable and relatively low-cost, and therefore can also be used in large population-based studies. Age- and gender-based equations for optimal calculation in the Indian population are needed.
Direct Methods
Isotope Dilution Method (Hydrometry)
Hydrometry is the measurement of TBW based on the already known concentration of the tracer (isotope). 13 Since it is mainly present in FFM, TBW can be used to estimate FFM. The isotopes used are D 2 O and 18 O. The isotope is measured in saliva, urine, or blood before and 3–4 hours after administration of the dose by isotope ratio mass spectrometry or infrared spectrophotometry. It is accurate within 1–2% to measure TBW. 32 The errors result from mistakes in the time taken to reach equilibrium, incorrect dilution, or errors in the measurement of the isotopic enrichment.
Whole-body Potassium Counter
The 4C model divides the body into fat, BCM, ECF, and extracellular solids (ECS). The BCM contains approximately 98 percent of the body’s potassium. 33 It is accurately measured with WBKC. It can also give an indirect estimate of body protein and skeletal muscle mass. 34 It is useful in conditions with changing hydration status, pregnancy, malnutrition, and infancy. The body potassium is estimated from the proportion of 40 K in the body. The total body nitrogen (TBN), protein (TBP), and BCM can be calculated with the equations and assumptions of potassium to nitrogen ratio of 2.15 mmol K/gm N, 35 TBP = 6.25 × TBN (gm), 36 and BCM (kg) = 0.0092 × TBK (mmol). 37
Criterion Methods
Hydrodensitometry (Underwater Weighing)
It is the estimation of total body density by measuring the displaced water when the body is fully submerged, along with measuring the residual lung volume. An individual with higher FFM will weigh more in water, as bone and muscle are denser than water, whereas an individual with higher FM will be lighter in water, as fat floats in water. The body fat can be estimated using the 2C model after measuring the body density. For correct measurement, it should account for air in the lungs and intestines. When compared to the 4C model, the UWW method has an error rate of –2.8 to 1.8%. 38 The method is time-consuming and uncomfortable for the individual.
Air Displacement Plethysmography
Air displacement plethysmography (ADP) measures the body volume (BV) by measuring the volume of air in an empty chamber and the volume of air in the chamber after the person sits in it, the difference being BV. The volume of the air is calculated from the changes in air pressure. 39 The whole process takes 5–8 minutes. The instrument is easy to use but is expensive and not widely available. The accuracy of this method is similar to UWW. 39 In a study from South India, BOD POD underestimated FM by 1.1%. 14
Dual-energy X-ray Absorptiometry
DEXA uses the principle of measurement of attenuation of X-rays with photon energies by the underlying tissue. It is fast, requires little technical assistance, and has low radiation exposure. It is the gold standard for measurement of bone mineral density. 40 It is also used for estimation of total and regional body fat and lean mass. It assesses body composition when compared to the 4C model with a mean error of 1.6 kg. 14 One drawback is that DEXA assumes that the amount of fat over bone is similar to bone-free tissue. Another limitation is that it assumes constant hydration of lean soft tissue. There is limited data from DEXA in children <2 years of age. 41
One DEXA scan exposes a patient to about 4–5 µSv of radiation, which is even lower than the natural background dose (6.7 µSv). 42 Proper positioning is important for accurate measurement of FM and FFM. Meals increase the lean mass in the trunk and whole body. 43 Whereas exercise can cause an apparent increase in FFM of limbs due to the movement of fluids from the trunk to the limb. 44 It is also important to position the patient correctly using the reference lines on the table. The patient should be positioned in the center of the scan without a pillow, the upper limbs lying on the side of the body without touching, and the lower limbs slightly internally rotated. 45 There should be uniformity while placing regional lines: the upper horizontal line under the jaw, while the pelvis horizontal placement is just above the iliac crests. The vertical lines separate limbs from the trunk on both sides, and one vertical line separates the legs ( Fig. 2 ). 46
Positioning of lines
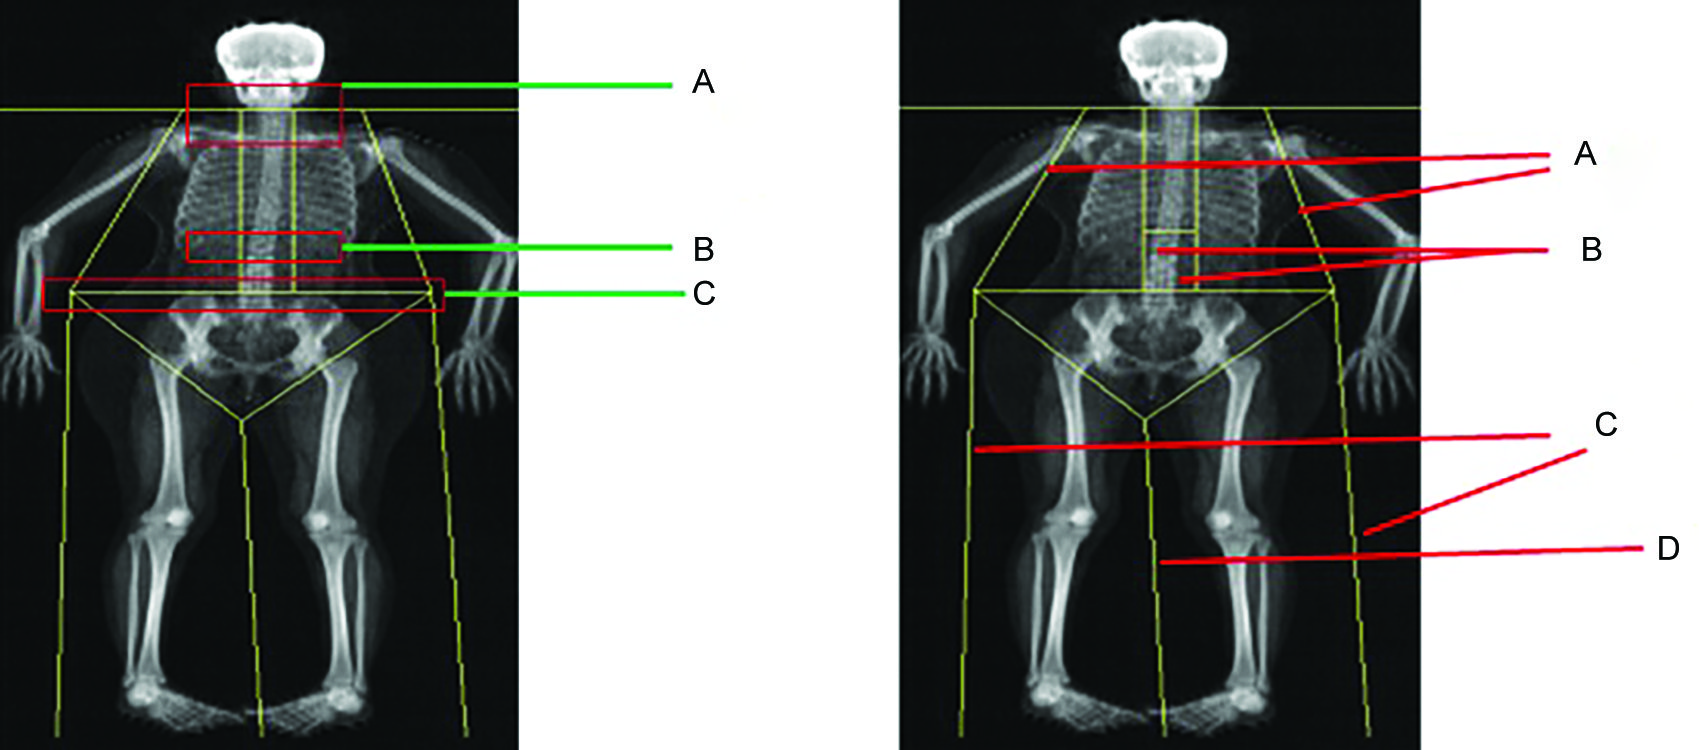
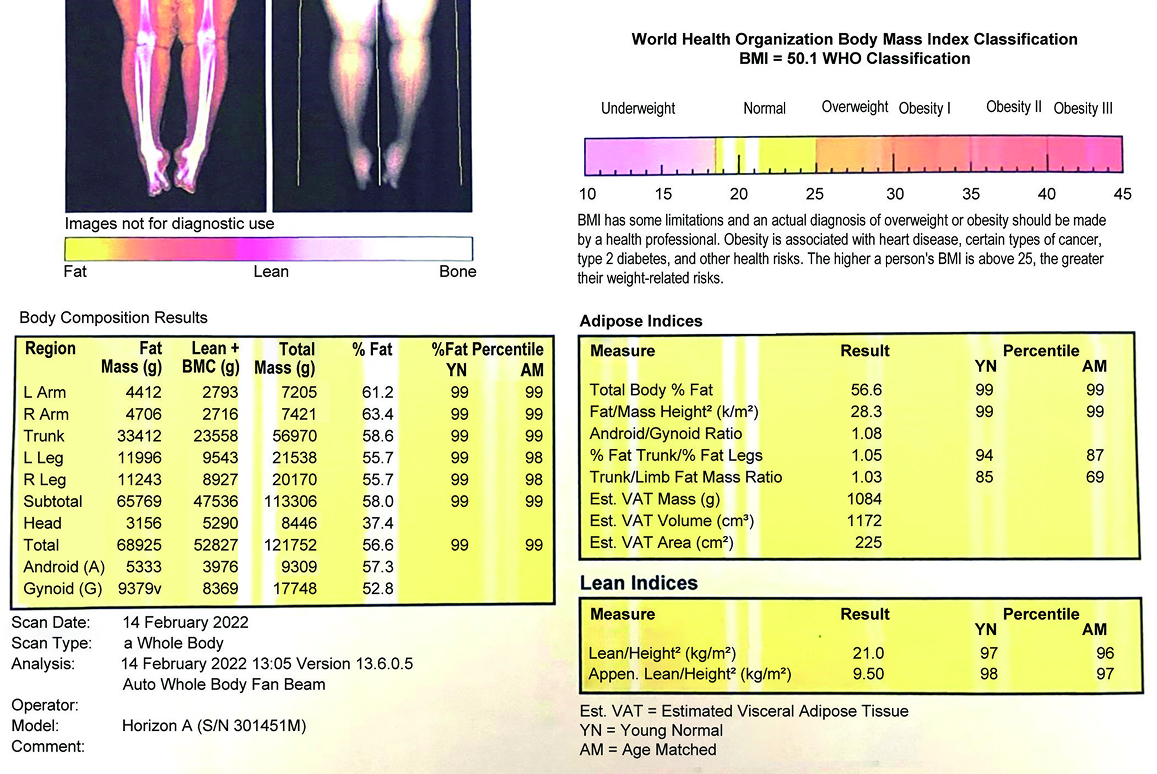
Figure 3 shows a typical body composition report with various adipose and lean indices, which can be used to interpret various case scenarios.
Typical body composition report by DXA
Sarcopenia:
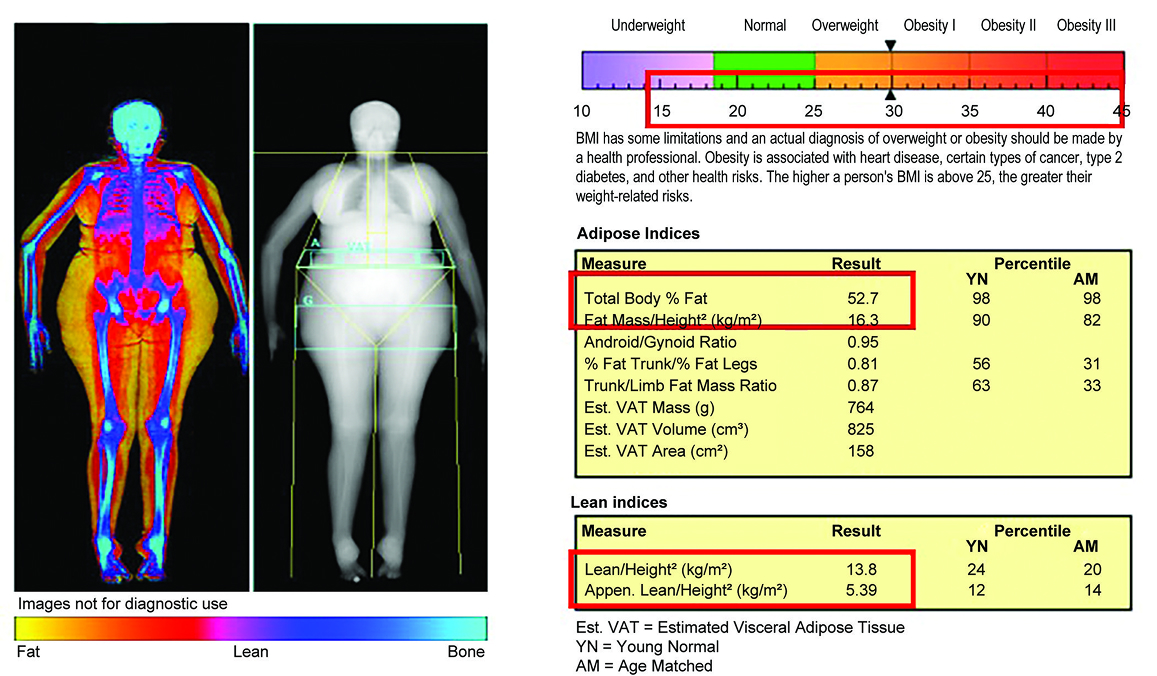
The European Working Group on Sarcopenia in Older People 2 (EWGSOP 2) has defined sarcopenia as two out of low muscle mass, low muscle strength, and low function. The South Asian Working Group on Sarcopenia 47 has defined the cutoff for Asian Indians: <7 kg/m 2 for males and <5.4 kg/m 2 for females. Figure 4 shows a case of sarcopenic obesity.
Adipose indices:
Fat mass index: It is defined as total fat mass divided by height. 2 The current thresholds for FMI are derived from NHANES data. 48 These are shown in Table 1 . Studies have shown that higher FMI corresponds to negative cardiovascular and metabolic outcomes. 49
Sarcopenic obesity
Fat mass index cutoff derived by NHANES data 48
| Ethnicity | FMI matching BMI (kg/m 2 ) | ||||
|---|---|---|---|---|---|
| <18.5 | >25 | >30 | >35 | >40 | |
| Caucasians | |||||
| Male | <2.9 | >6 | > 8.9 | >11.9 | >15 |
| Female | <4.9 | >9.2 | >12.9 | >16.8 | >20.6 |
| Non-Caucasians | |||||
| Male | <3 | >6.3 | >9.2 | >12.3 | >15.4 |
| Female | <5.2 | >9.4 | >12.8 | >16.1 | >19.2 |
In addition to FMI, absolute fat percentages are also mentioned. The ESI defines obesity with a fat percentage >25% in males and >30% in females. 20 This parameter is especially important in the concept of normal weight obesity (NWO), in which BMI falls in the normal range with higher fat percentages ( Fig. 5 ). In an epidemiological study, the Kerala Diabetes Prevention Programme 23 found that the prevalence of NWO was 37%, and they had similar cardiometabolic outcomes as people with higher BMI.
Normal weight obesity
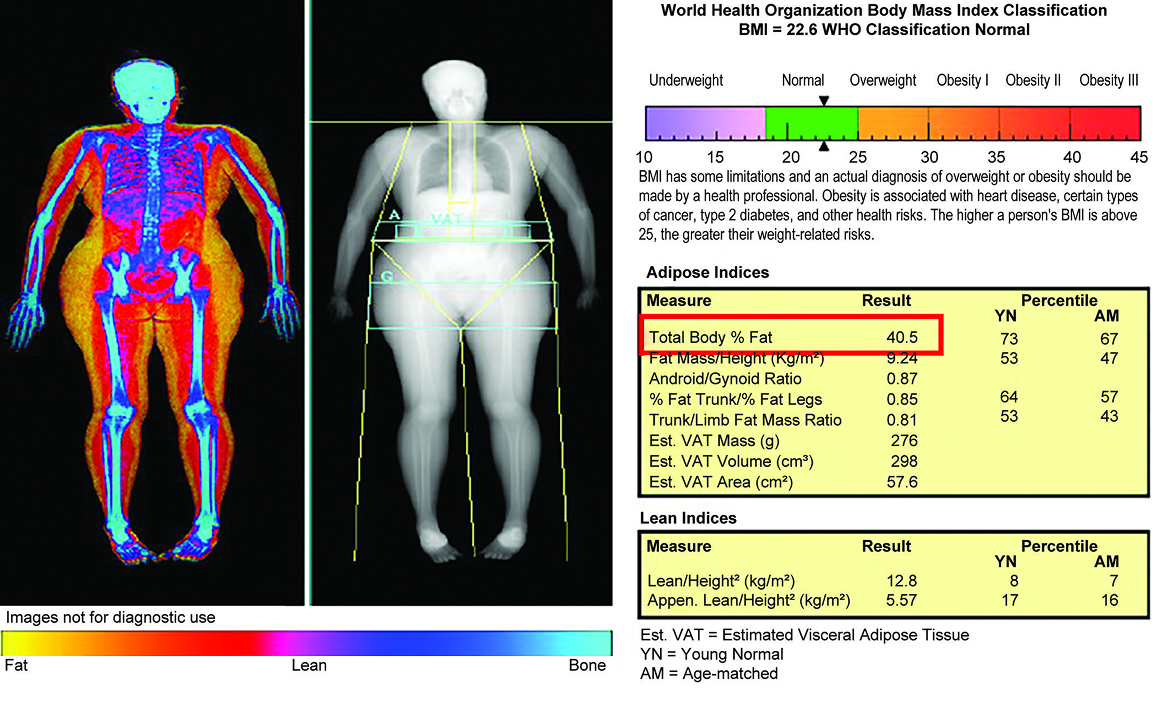
AG fat mass ratio: It is a DEXA analogue of WHR. It is defined as the ratio between the android region (between the last thoracic rib and the upper part of iliac wings) and the gynoid region (includes the gluteofemoral region with an upper horizontal line below the pelvis line, and a lower horizontal line identified by measuring twice the height of the android region). 46 An AG ratio >1 is linked with metabolic syndrome, dyslipidemia, hypertension, and insulin resistance. 50
Visceral vs subcutaneous fat:
The newer DXA machines have software CoreScan™ for GE-Lunar and InnerCore™ for Hologic. 46 These measure the subcutaneous fat. The visceral fat is then estimated by subtracting subcutaneous fat from the total FM.
Studies have shown that VAT >100 cm 2 is associated with adverse medical outcomes. 51 Pickhardt et al. found that VAT >70 cm 2 in women predicted metabolic syndrome with sensitivity and specificity of 83.7 and 80.0%, respectively. 52 They also showed that subcutaneous fat was a better predictor of metabolic syndrome and its complications in men, with a cutoff of >204 cm 2 .
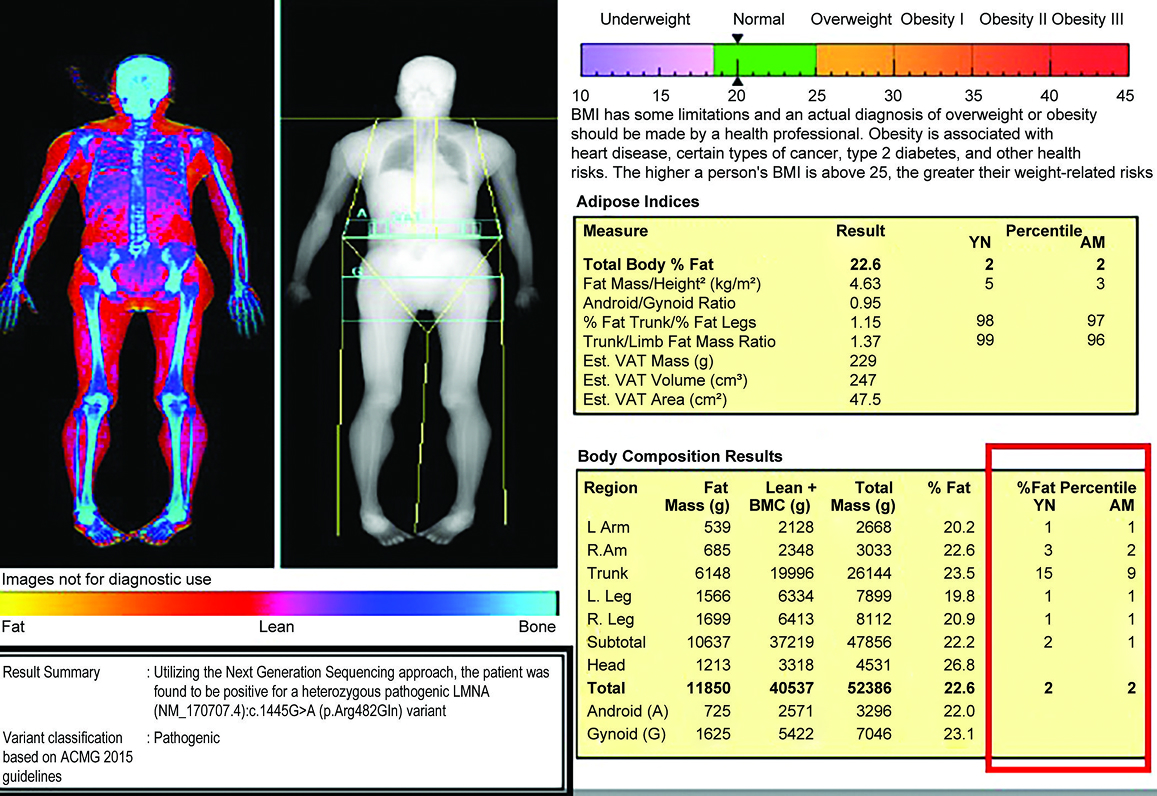
Lipodystrophy:
The differential fat distribution in genetic or acquired causes of lipodystrophy can also be studied with DXA ( Fig. 6 ). In a study in patients with HIV, 53 it was found that a trunk fat/lower limb fat mass ratio >2.28 predicted the people who would develop lipodystrophy and metabolic syndrome. It is also important to identify these people in the diabetes cohort to screen for other related diseases like nephrotic syndrome and fatty liver. Additionally, more than half of them can be managed with insulin sensitizers. 54
Lipodystrophy
Computed Tomography and Computed Tomography Body Composition
CT uses X-ray projections from different angles to give a 3D image of parts of the body, which are differentiated based on attenuation of the rays. It can accurately determine fat in the liver and skeletal muscle. 55 , 56 The body composition is done using 2D analysis of specific axial slices to minimize the radiation dose and technical difficulties. 57
Magnetic Resonance Imaging
MRI uses the magnetic properties of nuclei to estimate body composition. The precise measurement of adipose and lean tissue is done using “quantitative fat-water imaging,” which is based on Dixon imaging. 58 Since there is no ionizing radiation, it is useful even in infancy. However, like CT, body composition assessment using MRI is done with one- or two-dimensional slices. Since body movement can cause artifacts during image acquisition, infants need to be sleeping while the scan is done.
CONCLUSION
Body composition analysis has become an essential part in the evaluation of nutritional status, obesity phenotype, and the effect of any intervention. There are various techniques available for each age group, and the choice can be made based on feasibility, accuracy, cost, and the technical skill available.
ORCID
Nitin Kapoor https://orcid.org/0000-0002-9520-2072
REFERENCES
ARTICLE INFO
Publication history
Published: 01 April, 2025
Copyright
Copyright © 2025; The Author(s).